Set 2: Command of Evidence
Explanation
PASSAGE
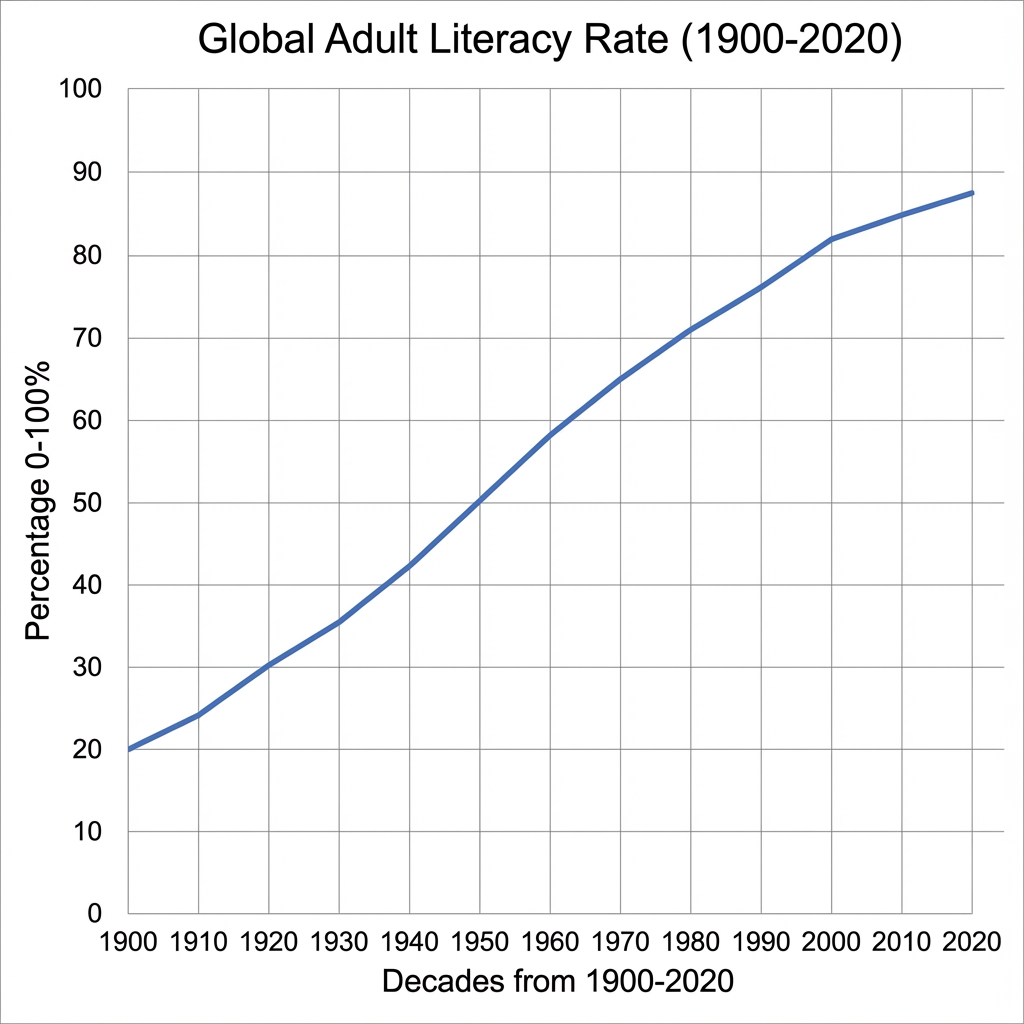
The graph shows the global adult literacy rate from 1900 to 2020. Literacy rates have been a key indicator of educational development worldwide.
Based on the graph, what trend does the global literacy rate show over the 120-year period?
Detailed Explanation
This question requires you to identify evidence that supports a claim. The line graph shows a clear upward trend, starting at approximately 20% in 1900 and rising steadily to about 87% by 2020. The best evidence directly and explicitly supports the stated claim without requiring assumptions. Match specific textual details or data points to the claim being made. The correct answer provides clear, direct support. Strong evidence directly addresses the claim without requiring additional interpretation. When evaluating options, look for quotes or data that explicitly support the statement. Weak evidence may be tangentially related but doesn't provide direct proof.
Key Evidence:
• "The graph shows the global adult literacy rate from 1900 to 2020"
Why others are wrong: A (The line increases, not decreases.), C (The line clearly rises over time.), D (There is no decline; the rate continues rising.).