Set 2: Command of Evidence
Explanation
PASSAGE
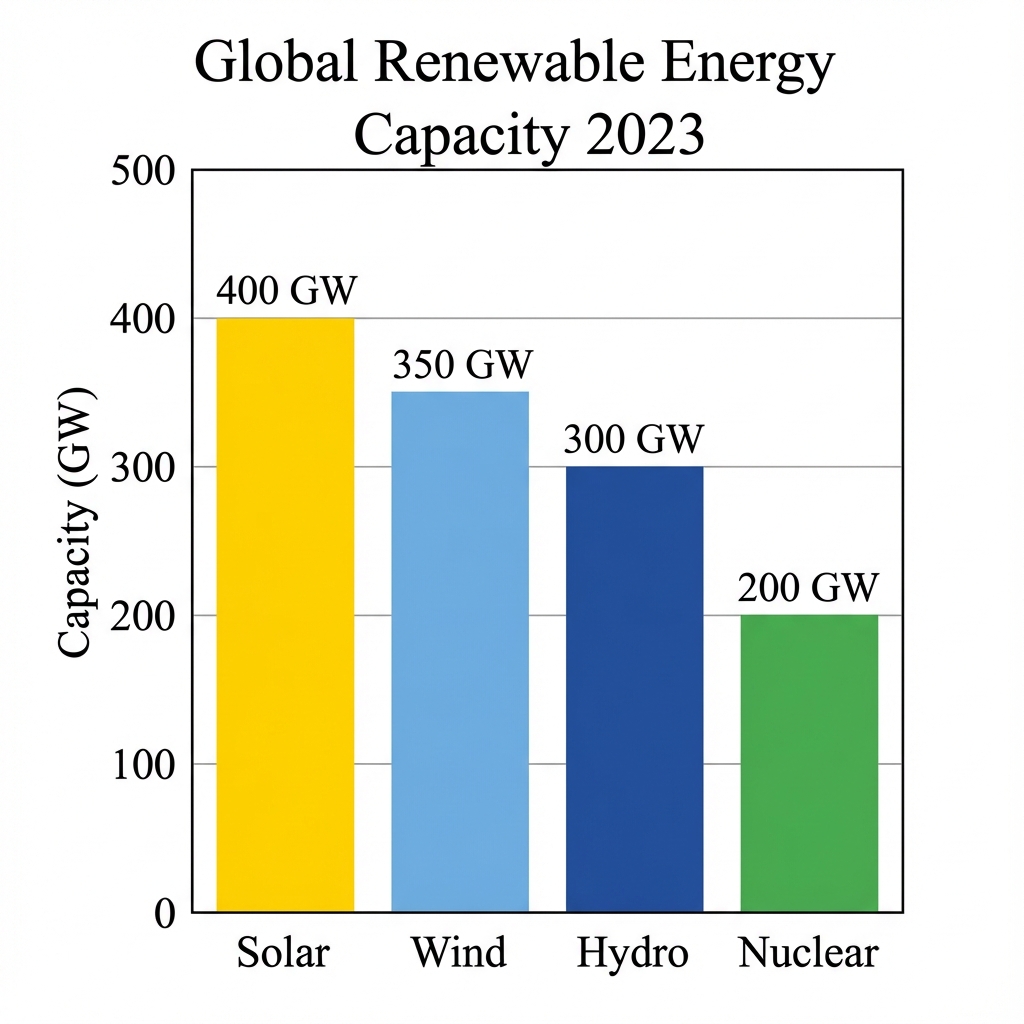
The chart shows global renewable energy capacity by source in 2023. Energy analysts are debating which source should receive the most investment going forward.
According to the chart, which energy source has the highest installed capacity?
Detailed Explanation
This question requires you to identify evidence that supports a claim. The bar for Solar (400 GW) is the tallest, indicating it has the highest capacity among the four sources shown. The best evidence directly and explicitly supports the stated claim without requiring assumptions. Match specific textual details or data points to the claim being made. The correct answer provides clear, direct support. Strong evidence directly addresses the claim without requiring additional interpretation. When evaluating options, look for quotes or data that explicitly support the statement. Weak evidence may be tangentially related but doesn't provide direct proof.
Key Evidence:
• "The chart shows global renewable energy capacity by source in 2023"
Why others are wrong: B (This option is incorrect.), C (Hydro (300 GW) is third.), D (Nuclear (200 GW) is the lowest.).