Set 1: Command of Evidence
Explanation
PASSAGE
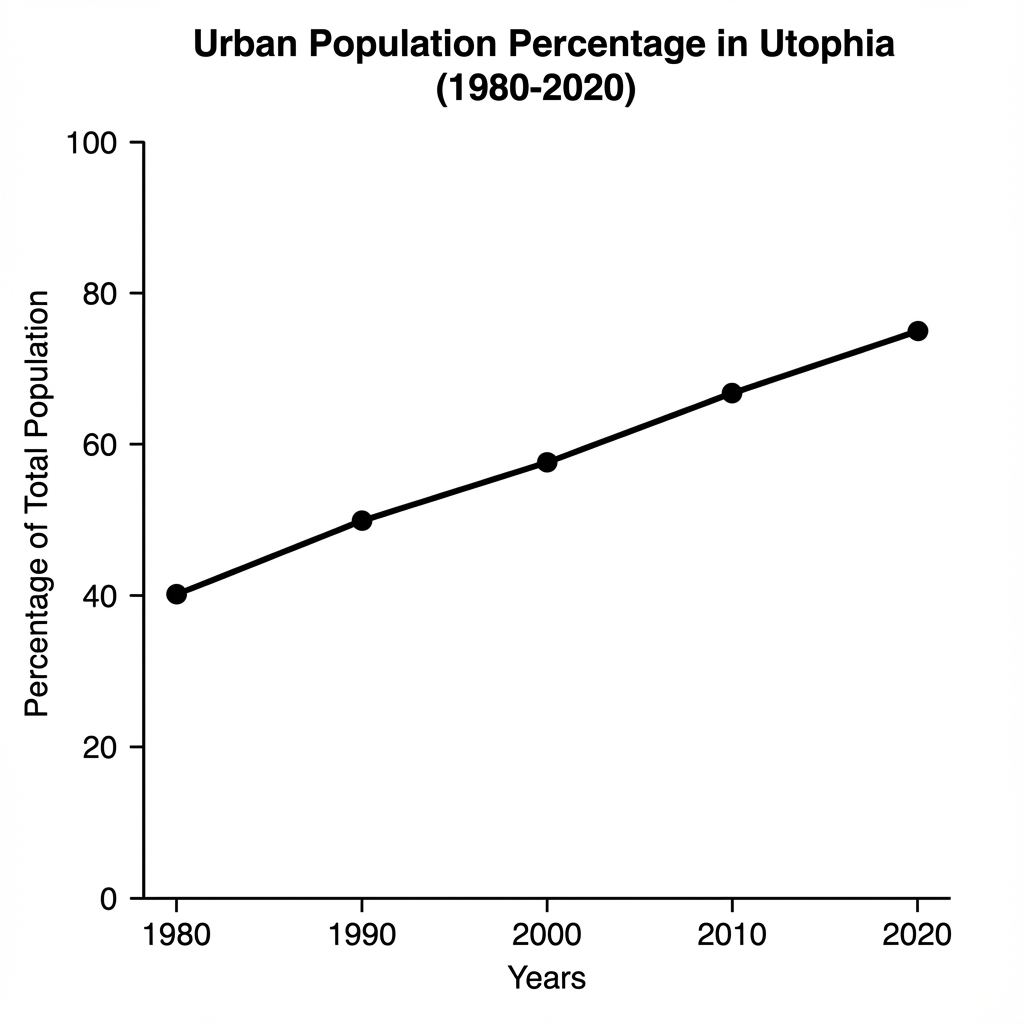
Urbanization is a global trend, but the rate varies by region. The line graph illustrates the percentage of the total population living in urban areas in the fictional country of Utophia from 1980 to 2020.
Based on the graph, which of the following statements is accurate?
Detailed Explanation
This question requires you to identify evidence that supports a claim. The line in the graph shows a steady upward trend without any flat or decreasing sections from 1980 through 2020, indicating a continuous increase in the urban population percentage. The best evidence directly and explicitly supports the stated claim without requiring assumptions. Match specific textual details or data points to the claim being made. The correct answer provides clear, direct support. Strong evidence directly addresses the claim without requiring additional interpretation. When evaluating options, look for quotes or data that explicitly support the statement. Weak evidence may be tangentially related but doesn't provide direct proof.
Key Evidence:
• "Urbanization is a global trend, but the rate varies by region"
Why others are wrong: A (The line continues to rise between 2000 and 2010; it is not flat.), B (In 1980, the data point is at 40%, which is less than 50%.), D (The slope appears relatively consistent; the graph does not show a significantly sharper increase in that specific decade compared to others.).