Set 1: Command of Evidence (Intermediate)
Explanation
PASSAGE
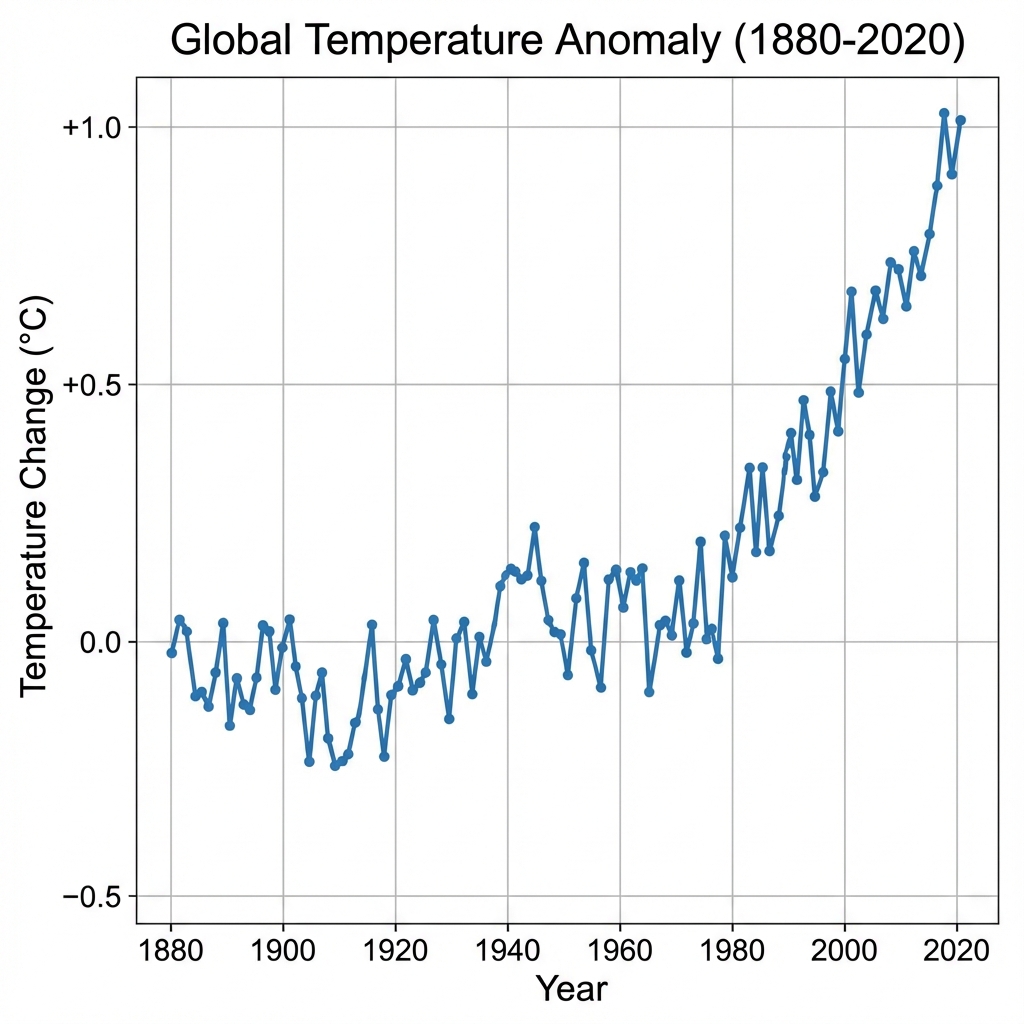
A climate researcher is analyzing trends in global temperature anomalies from 1880 to 2020. The data shows the deviation from a long-term average.
Based on the graph, which claim about global temperature is best supported?
Detailed Explanation
This question requires you to identify evidence that supports a claim. The graph shows relatively flat temperatures from 1880-1980, then a sharp upward trend after 1980. This demonstrates accelerated warming in recent decades. The best evidence directly and explicitly supports the stated claim without requiring assumptions. Match specific textual details or data points to the claim being made. The correct answer provides clear, direct support. Strong evidence directly addresses the claim without requiring additional interpretation. When evaluating options, look for quotes or data that explicitly support the statement. Weak evidence may be tangentially related but doesn't provide direct proof.
Key Evidence:
• "Sharp rise after 1980"
• "Steeper slope in recent decades"
Why others are wrong: B (This option is incorrect.), C (Temperatures continue rising past 1940.), D (Post-2000 shows the HIGHEST temperatures, not coldest.).