Set 1: Command of Evidence (Advanced)
Explanation
PASSAGE
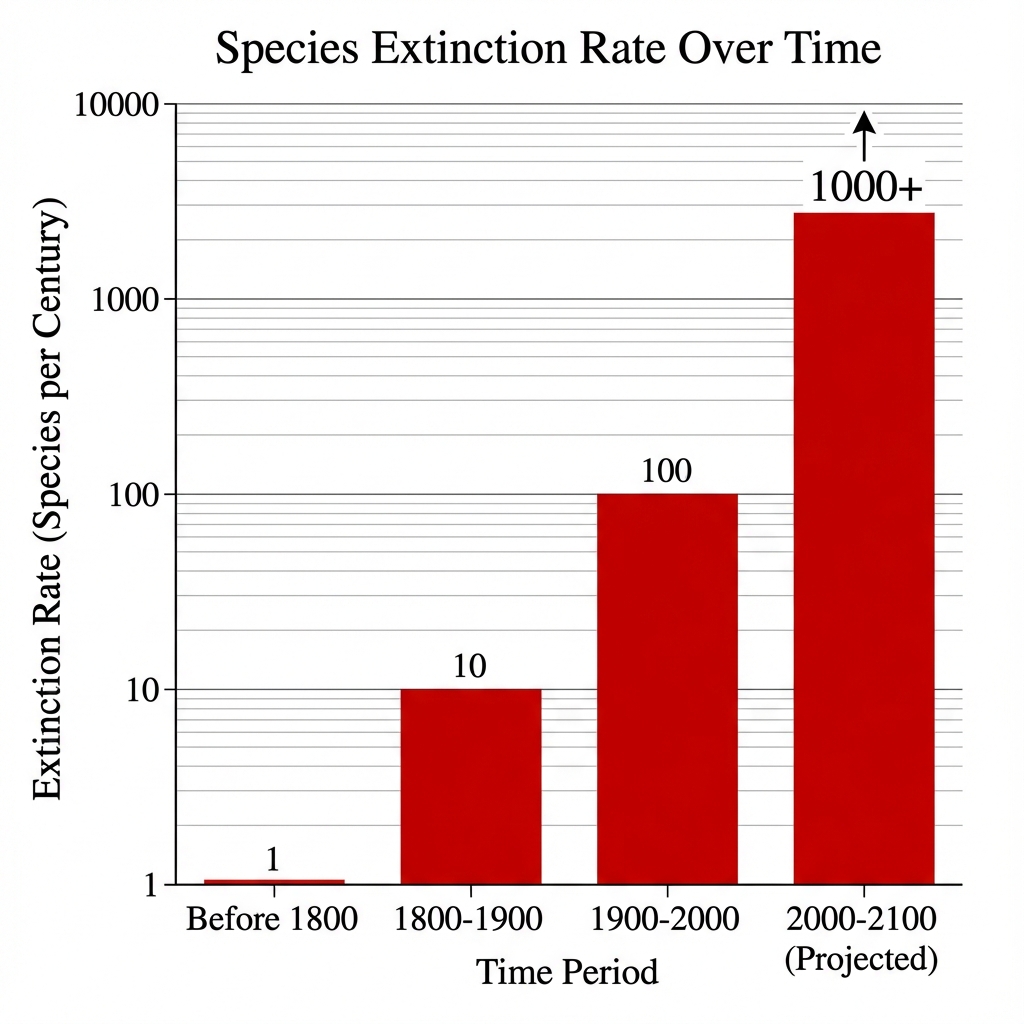
A conservation biologist is presenting data on species extinction rates over historical time periods. The graph uses a logarithmic scale to show the dramatic increase in extinction rates.
Which conclusion is best supported by the data in the graph?
Detailed Explanation
This question requires you to identify evidence that supports a claim. The logarithmic scale reveals an exponential increase in extinction rates. Before 1800: ~1 species/century. By 2000: ~100 species. Projected 2100: 1000+ species. This is a dramatic acceleration. The best evidence directly and explicitly supports the stated claim without requiring assumptions. Match specific textual details or data points to the claim being made. The correct answer provides clear, direct support. Strong evidence directly addresses the claim without requiring additional interpretation. When evaluating options, look for quotes or data that explicitly support the statement. Weak evidence may be tangentially related but doesn't provide direct proof.
Key Evidence:
• "Logarithmic scale showing exponential growth"
• "Sharp rise in recent centuries"
Why others are wrong: B (This option is incorrect.), C (Rates continued to rise dramatically in the 20th century.), D (Most extinctions are recent and projected for the future.).