8
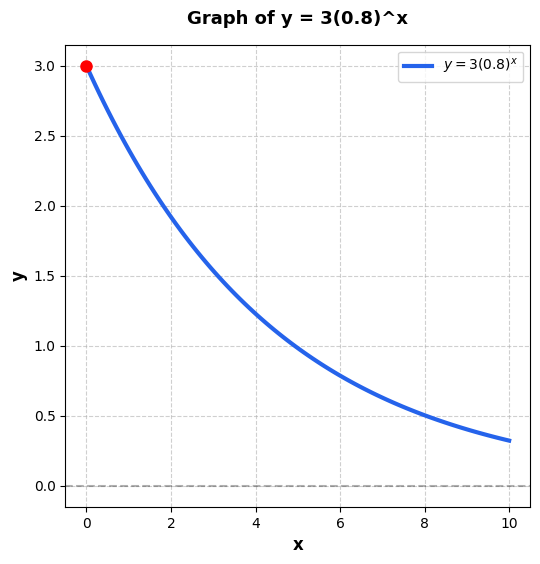
advanced-mathWhich graph represents the function ?
A
Graph with y-intercept 3, decreasing
B
Graph with y-intercept 3, increasing
C
Graph with y-intercept 0.8, decreasing
D
Graph with y-intercept 0.8, increasing
Correct Answer: A
Choice A is the correct answer. Analyze the initial value and direction.
- Initial Value: When , , so y-intercept is 3.
- Base: means the function is decaying (decreasing).
- Match: Graph with y-intercept 3 and decreasing curve.
💡 Strategic Tip: If , the graph decreases (decay). If , it increases (growth).
Choice B is incorrect because the base 0.8 < 1 means decay, not growth. Choice C is incorrect because the y-intercept is 3, not 0.8. Choice D is incorrect because both the y-intercept and direction are wrong.