Set 8: Exponential Functions (Intermediate)
Explanation
The graph shows two functions. Which statement is true?
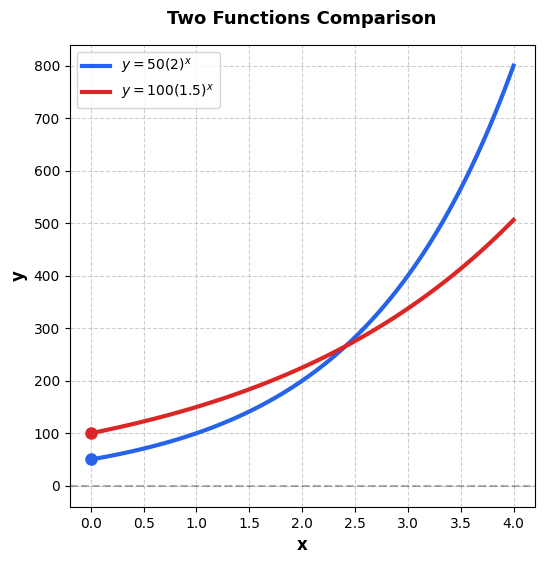
Both are exponential
The red curve is linear, blue is exponential
The blue curve is linear, red is exponential
Both are linear
Detailed Explanation
Choice C is correct. Choice C is the correct answer. Identify the curve shapes. 1. Blue Curve: Straight line → Linear function. 2. Red Curve: Curved, getting steeper → Exponential growth. 3. Key Difference: Linear has constant slope, exponential has increasing rate of change. Strategic Tip: Exponential graphs curve sharply upward (growth) or downward (decay), while linear graphs are straight lines. Choice A is incorrect because one curve is clearly straight (linear). Choice B is incorrect because it reverses which curve is which. Choice D is incorrect because the red curve is not straight.
Key Steps:
The correct answer is The blue curve is linear, red is exponential
🎯 Keep Practicing!
Master all sections for your best SAT score