2
Answer: BSet 7: Exponential Functions
Explanation
Which statement describes the graph of ?
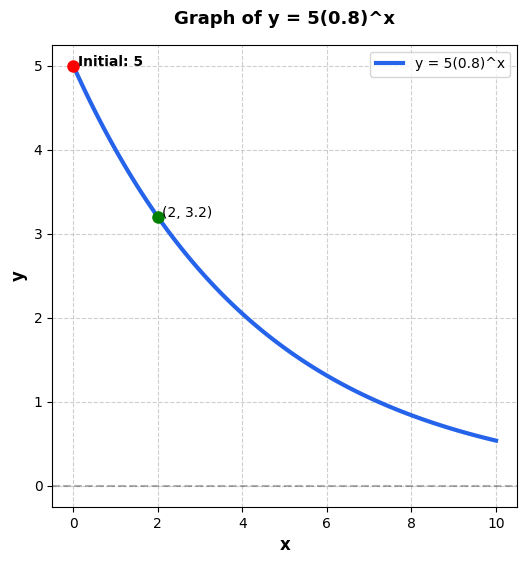
A.
Starts at 5 and goes up.
B.✓ Correct
Starts at 5 and goes down.
C.
Starts at 0.8 and goes up.
D.
Starts at 0.8 and goes down.
Detailed Explanation
Choice B is correct. Choice B is the correct answer. Analyze and . 1. Initial: , so it starts at y=5. 2. Decay: , so it is decreasing (going down). Strategic Tip: Base means the graph slides down like a slide. Choice A is incorrect because it would need . Choice C is incorrect because initial value is 5, not 0.8.
Key Steps:
•
The correct answer is Starts at 5 and goes down.
Why others are wrong:
A: Choice A is incorrect and may result from a calculation error.
C: Choice C is incorrect and may result from a calculation error.
D: Choice D is incorrect and may result from a calculation error.
🎯 Keep Practicing!
Master all sections for your best SAT score