7
Answer: ASet 14: Exponential Functions
Explanation
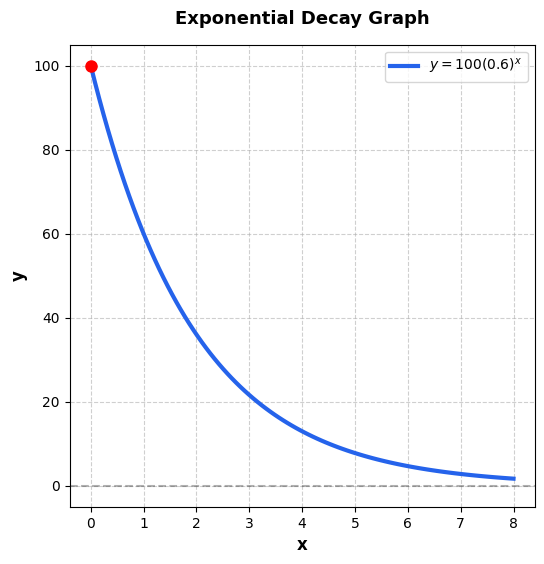
Which equation best represents the exponential decay curve shown in the graph?
A.
✓ Correct
B.
C.
D.
Detailed Explanation
Choice A is correct. Choice A is the correct answer. The graph shows exponential decay starting at when . 1. Initial Value: The y-intercept is 100, so . 2. Decay Factor: The curve decreases, indicating . The shape matches . 3. Verify: At , , which matches the graph. Strategic Tip: For exponential decay, always check that the base is between 0 and 1. Choice B is incorrect because a base greater than 1 represents growth, not decay. Choice C is incorrect because the initial value is 100, not 50. Choice D is incorrect because 1.5 > 1 represents growth.
Key Steps:
•
The correct answer is
Why others are wrong:
B: Choice B is incorrect and may result from a calculation error.
C: Choice C is incorrect and may result from a calculation error.
D: Choice D is incorrect and may result from a calculation error.
🎯 Keep Practicing!
Master all sections for your best SAT score