Set 13: Exponential Functions
Explanation
A petri dish starts with 200 bacteria. The population doubles every 4 hours. Which graph best represents this?
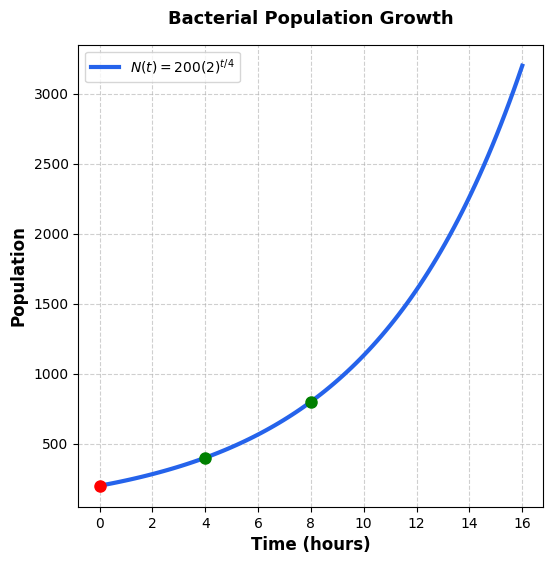
Increasing curve, y-intercept 200, steep growth
Decreasing curve, y-intercept 200
Straight line through (0, 200)
Increasing curve, y-intercept 400
Detailed Explanation
Choice A is correct. Choice A is the correct answer. Match the description to graph features. 1. Initial: 200 bacteria → y-intercept at 200. 2. Doubling: Population increases → growing curve, not decreasing. 3. Shape: Exponential growth curves upward steeply. 4. Equation: . Strategic Tip: Doubling = exponential growth = upward curving graph. Choice B is incorrect because the population grows, not decreases. Choice C is incorrect because doubling is exponential, not linear. Choice D is incorrect because the initial value is 200, not 400.
Key Steps:
The correct answer is Increasing curve, y-intercept 200, steep growth
🎯 Keep Practicing!
Master all sections for your best SAT score